6% Method: An Alternative To The 4% Rule
By David M. Zolt, CFP®, EA, ASA, MAAA
For over 20 years, the 4% Rule has served as an invaluable benchmark for gauging whether a retiree is overspending from their portfolio. However, the 4% Rule is a theoretical model, not a withdrawal strategy. Retirees don’t automatically increase their monthly stipend at the beginning of each year by the prior year’s CPI increase.
Retirees are often told that they need to monitor their portfolio periodically and adjust their withdrawal when necessary. Unfortunately, this task is easier said than done. There is a great need for a tool to address this challenge.
Retirement researchers have proposed various metrics to determine when the long-term sustainability of a retiree’s portfolio is at risk and what actions to take when this occurs to extend portfolio lifetime. Unfortunately, these techniques are too cumbersome or not effective enough to implement as a withdrawal strategy. That’s why I developed the 6% Method.
The 6% Method
Here’s how it works. In the initial year of retirement, the retiree withdraws 6% of their portfolio to pay their living expenses including income taxes and investment fees. Each year thereafter, the retiree may increase their annual withdrawal for inflation only if the resulting annual withdrawal is less than 6% of their portfolio at the beginning of the year. For example, let’s assume at the beginning of year 10 of retirement, Mary’s portfolio is $800,000. In year 9, Mary withdrew $50,000 from her portfolio to pay living expenses and the CPI increased by 2%. If Mary took an inflation increase at the beginning of year 10, her annual withdrawal for year 10 would be $51,000. Since $51,000 exceeds 6% of $800,000, Mary should not take an inflation increase for the year. Her annual withdrawal for year 10 should be $50,000, the same as she withdrew in year 9.
If Mary’s retirement portfolio had been $900,000, then she would have been safe to take an inflation increase at the beginning of year 10 because $51,000 is less than 6% of $900,000.
Probability of Success Remains about the Same
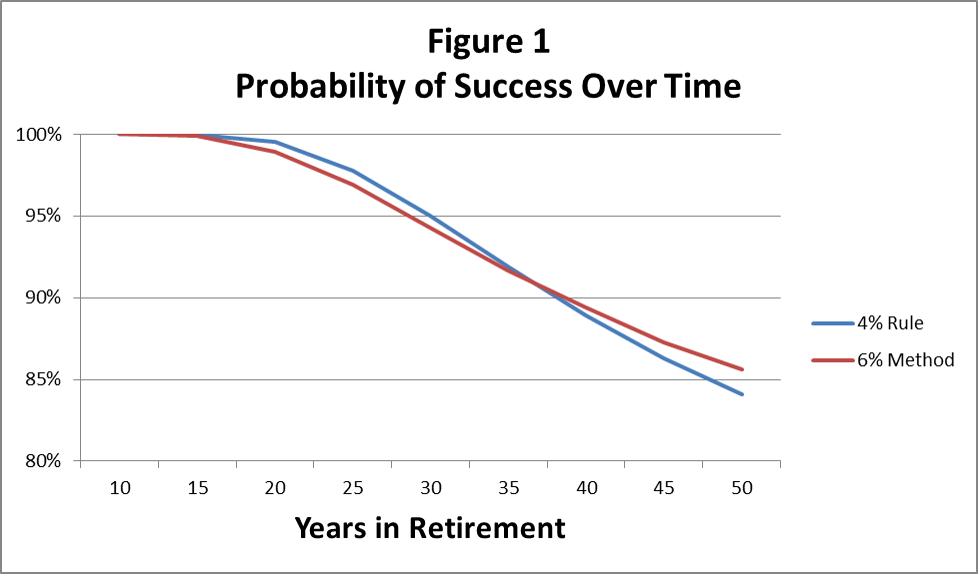
Figure 1 shows a comparison of the probability of success under the 4% Rule and the 6% Method. Probabilities are based on a model portfolio of 50% stocks and 50% bonds.[i] As you can see, the 4% Rule has a slightly higher success probability in the early years, but the 6% Method wins in the later years of retirement. Overall, the probabilities are very close. Note that the difference in the probability of success between the two approaches is less than 1% during each of the first 40 years of retirement.
Purchasing Power
The 4% Rule provides that the purchasing power of withdrawals will never decline. Under the 6% Method, purchasing power may decline over time.
Table 1 illustrates the probability of purchasing power decline under the 6% Method. On the upside, there’s a better than 10% chance you will never need to skip an inflation increase and your purchasing power will remain unchanged (the top decile). On the downside, there’s a 10% probability that purchasing power in year 30 of retirement will be 42% or less of your original purchasing power (the bottom decile).
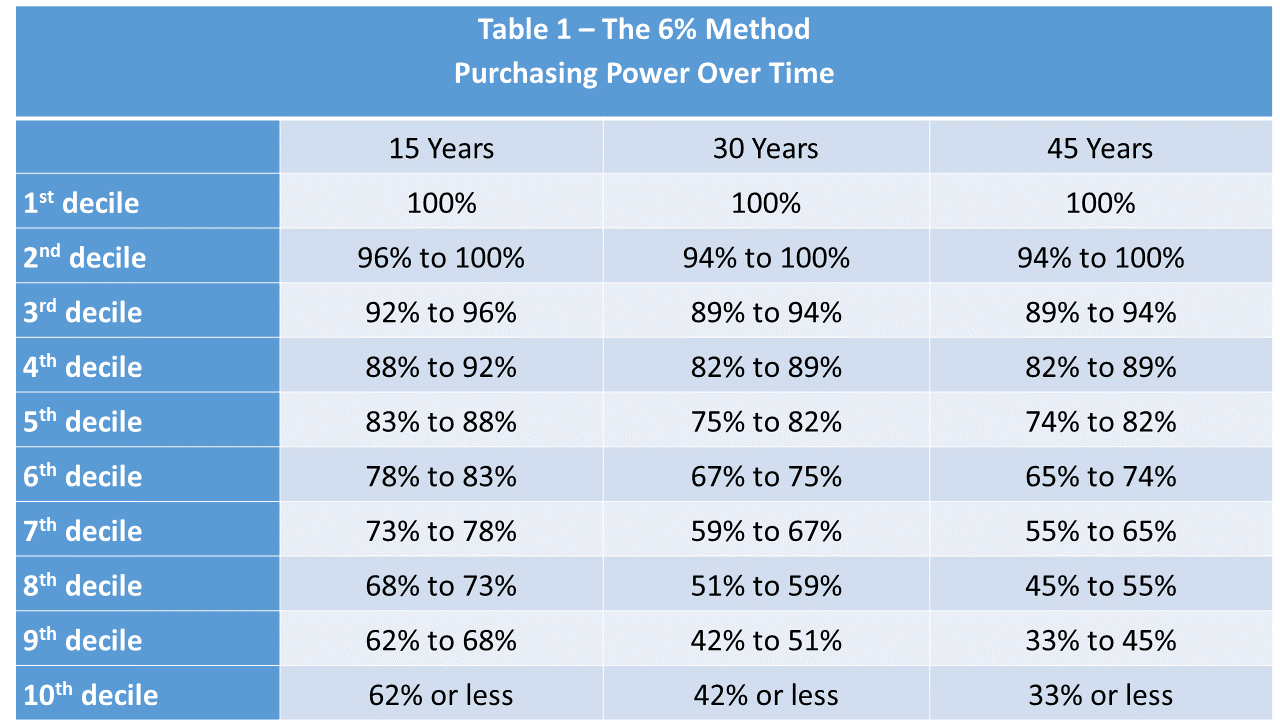
There’s a 50% likelihood that your purchasing power will be at least 83% of your original purchasing power in year 15, at least 75% of your original purchasing power in year 30, and at least 74% of your original purchasing power in year 45. Also, there’s an 80% chance that your purchasing power will be at least 68% of your original purchasing power in year 15, at least 51% of your original purchasing power in year 30, and at least 45% of your original purchasing power in year 45. You or your client may be willing to take this risk in order to start retirement with 50% higher portfolio withdrawals.
Note that as long as purchasing power is 67% or more, your withdrawals are still higher than if you had followed the 4% Rule. Since purchasing power at the bottom of the sixth decile at 30 years is 67%, there’s a 60% likelihood that withdrawals under the 6% Method will never be less than under the 4% Rule during the first 30 years of retirement. Also, since purchasing power at the bottom of the sixth decile at 45 years is 65%, there’s a 60% likelihood that withdrawals under the 6% Method will never be less than 97.5% (= 6% times 65% divided by 4%) of your withdrawals under the 4% Rule during the first 45 years of retirement.
Conclusion
The 6% Method is a withdrawal strategy that allows retirees to initially spend 50% more than the 4% Rule with essentially the same probability of sustaining their portfolio long-term. However, the price for higher initial withdrawals is the risk of purchasing power decline over time.
Even if you choose not to adopt the 6% Method in practice, this analysis demonstrates that initial withdrawal rates up to 6% are safe as long as you don’t increase withdrawals from year to year when your portfolio withdrawal rate exceeds 6%.
About David Zolt
David M. Zolt, CFP®, EA, ASA, MAAA, is a comprehensive, fee-only financial planner and president of Westlake Advisors, a registered investment adviser in Westlake, Ohio. He is the developer of The Retirement Planner software (www.RetireSoft.com). Contact him at david at retiresoft.com.
[i] The model portfolio assumes 40% large-cap stocks, 10% small-cap stocks, and 50% intermediate-term government bonds with annual rebalancing. The allocation between large-cap and small-cap was selected to simulate the total U.S. stock market. Historical 1926 to 2014 data were taken from the Ibbotson® SBBI® Classic Yearbook. Monte Carlo simulations of 100,000 iterations each with normal distributions were performed. Probabilities shown in this article are based on a 50/50 stock/bond allocation. Withdrawal rate tables based on five different asset allocations can be found at www.RetireSoft.com/WithdrawalRates.
This Website Is For Financial Professionals Only